Written by Kay Ewbank via http://www.i-programmer.info
SAP BusinessObjects is working on a new design framework called LAVA (Lightweight Applied Visual Analytics), a methodology that will change the way data is displayed to move away from traditional dashboards.
The details of LAVA were discussed in a blog post by Anita Gibbings, SAP’s director of BI solutions marketing.
The thinking behind LAVA starts with the familiar software dashboard; Gibbings points out that while the dashboard metaphor is a good one for displaying critical status information, it’s not necessary to limit software to the physical forms and their associated limitations. Round information displays, like pie charts and rotary dials, are less-efficient and -effective holdovers from mechanical displays, and don’t illustrate one-dimensional quantitative expressions well because people find it difficult to accurately perceive spatial relationships of round areas, and it’s difficult to insert text titles in the segments. Gibbings also points out that traffic lights are obvious for “stop, go, caution” but are an awkward, forced translation into “bad, good, and so-so”.
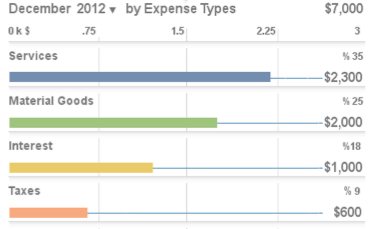
The good parts of dashboards – horizontal bar charts with labels placed above the bars, with ample space for full labels, a wider bar area for more precise quantitative plots, and a clear comparison between the grouped bars, is, says Gibbing, a technique that along with many others is being built into SAP’s visual analytic tools via LAVA, the new visual analytics design language.
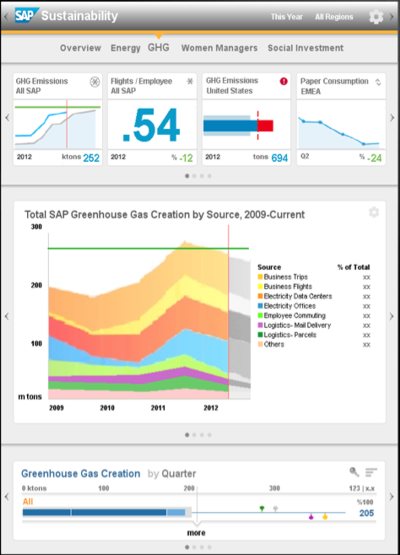
Design Languages are more a framework than a language, a basic set of guidelines, forms, and techniques to be used across products to ensure best practices, consistency, and reliability. The LAVA design has six main factors with Lean Appearance being the first. This is a clean, minimal display style that focuses on the data itself rather than on “irrelevant faux decorations like gradations, drop shadows, or reflective surfaces.”
Points are next; mini charts with pre-determined constraints to ensure clear and efficient depiction of simple quantitative facts. Gibbings says: “Think of them as ‘chart tweets’.”
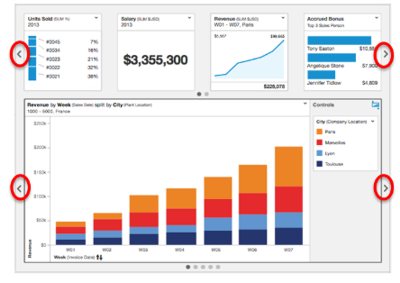
Channels, simple containers for displaying and navigating to multiple Points and Charts, are another of the ideas behind LAVA. What SAP means by channels is a way to collect and deploy analytic components in a display space by giving a way to cycle among a set of charts gathered into a collection. The user would move between the charts using ‘cross platform’ methods such as clicking or tapping the left/right arrows, or swiping on a touch screen.
Boards are containers for channels and free-standing charts, and are essentially dashboards renamed to “create distance from the previous generation of “dashboards” and their legacy constraints.”
A key feature of the display is that of the lattice chart. These are essentially multi-layer bar charts that users can manipulate by drilling-down, filtering and other operations. Gibbings says they’re a type of metacharts, charts that are bigger and more sophisticated than a typical chart, but smaller and less specific than a custom analytic application: “They fill a niche to provide pre-configured and embeddable display, manipulation, personalization, and light analysis experiences to a wider body of less-technical and less-analytic users.” Lattice charts have controls for manipulation embedded in the content display itself, doing away with the separate palettes, toolbars, and control panels located in the frames of traditional applications.
The final idea in LAVA is the annoyingly named Sn@p navigation. This lets users reuse existing elements to create their own displays, particularly by reusing the points mini charts, collecting them into Highlights pages and having them serve as small-footprint representations of their parent Boards while embedded within other applications, according to the blog post.
The ideas behind LAVA are being used to develop future versions of SAP visual analytics, and Gibbings says more details will be given ‘probably in a month or so’ on how and when LAVA will be made available in SAP Lumira and elsewhere. That, by coincidence, is when SAP’s annual Business Objects user group conference happens.
| read more at : http://www.i-programmer.info/news/197-data-mining/6268-lightweight-analytics-from-sap.html |